
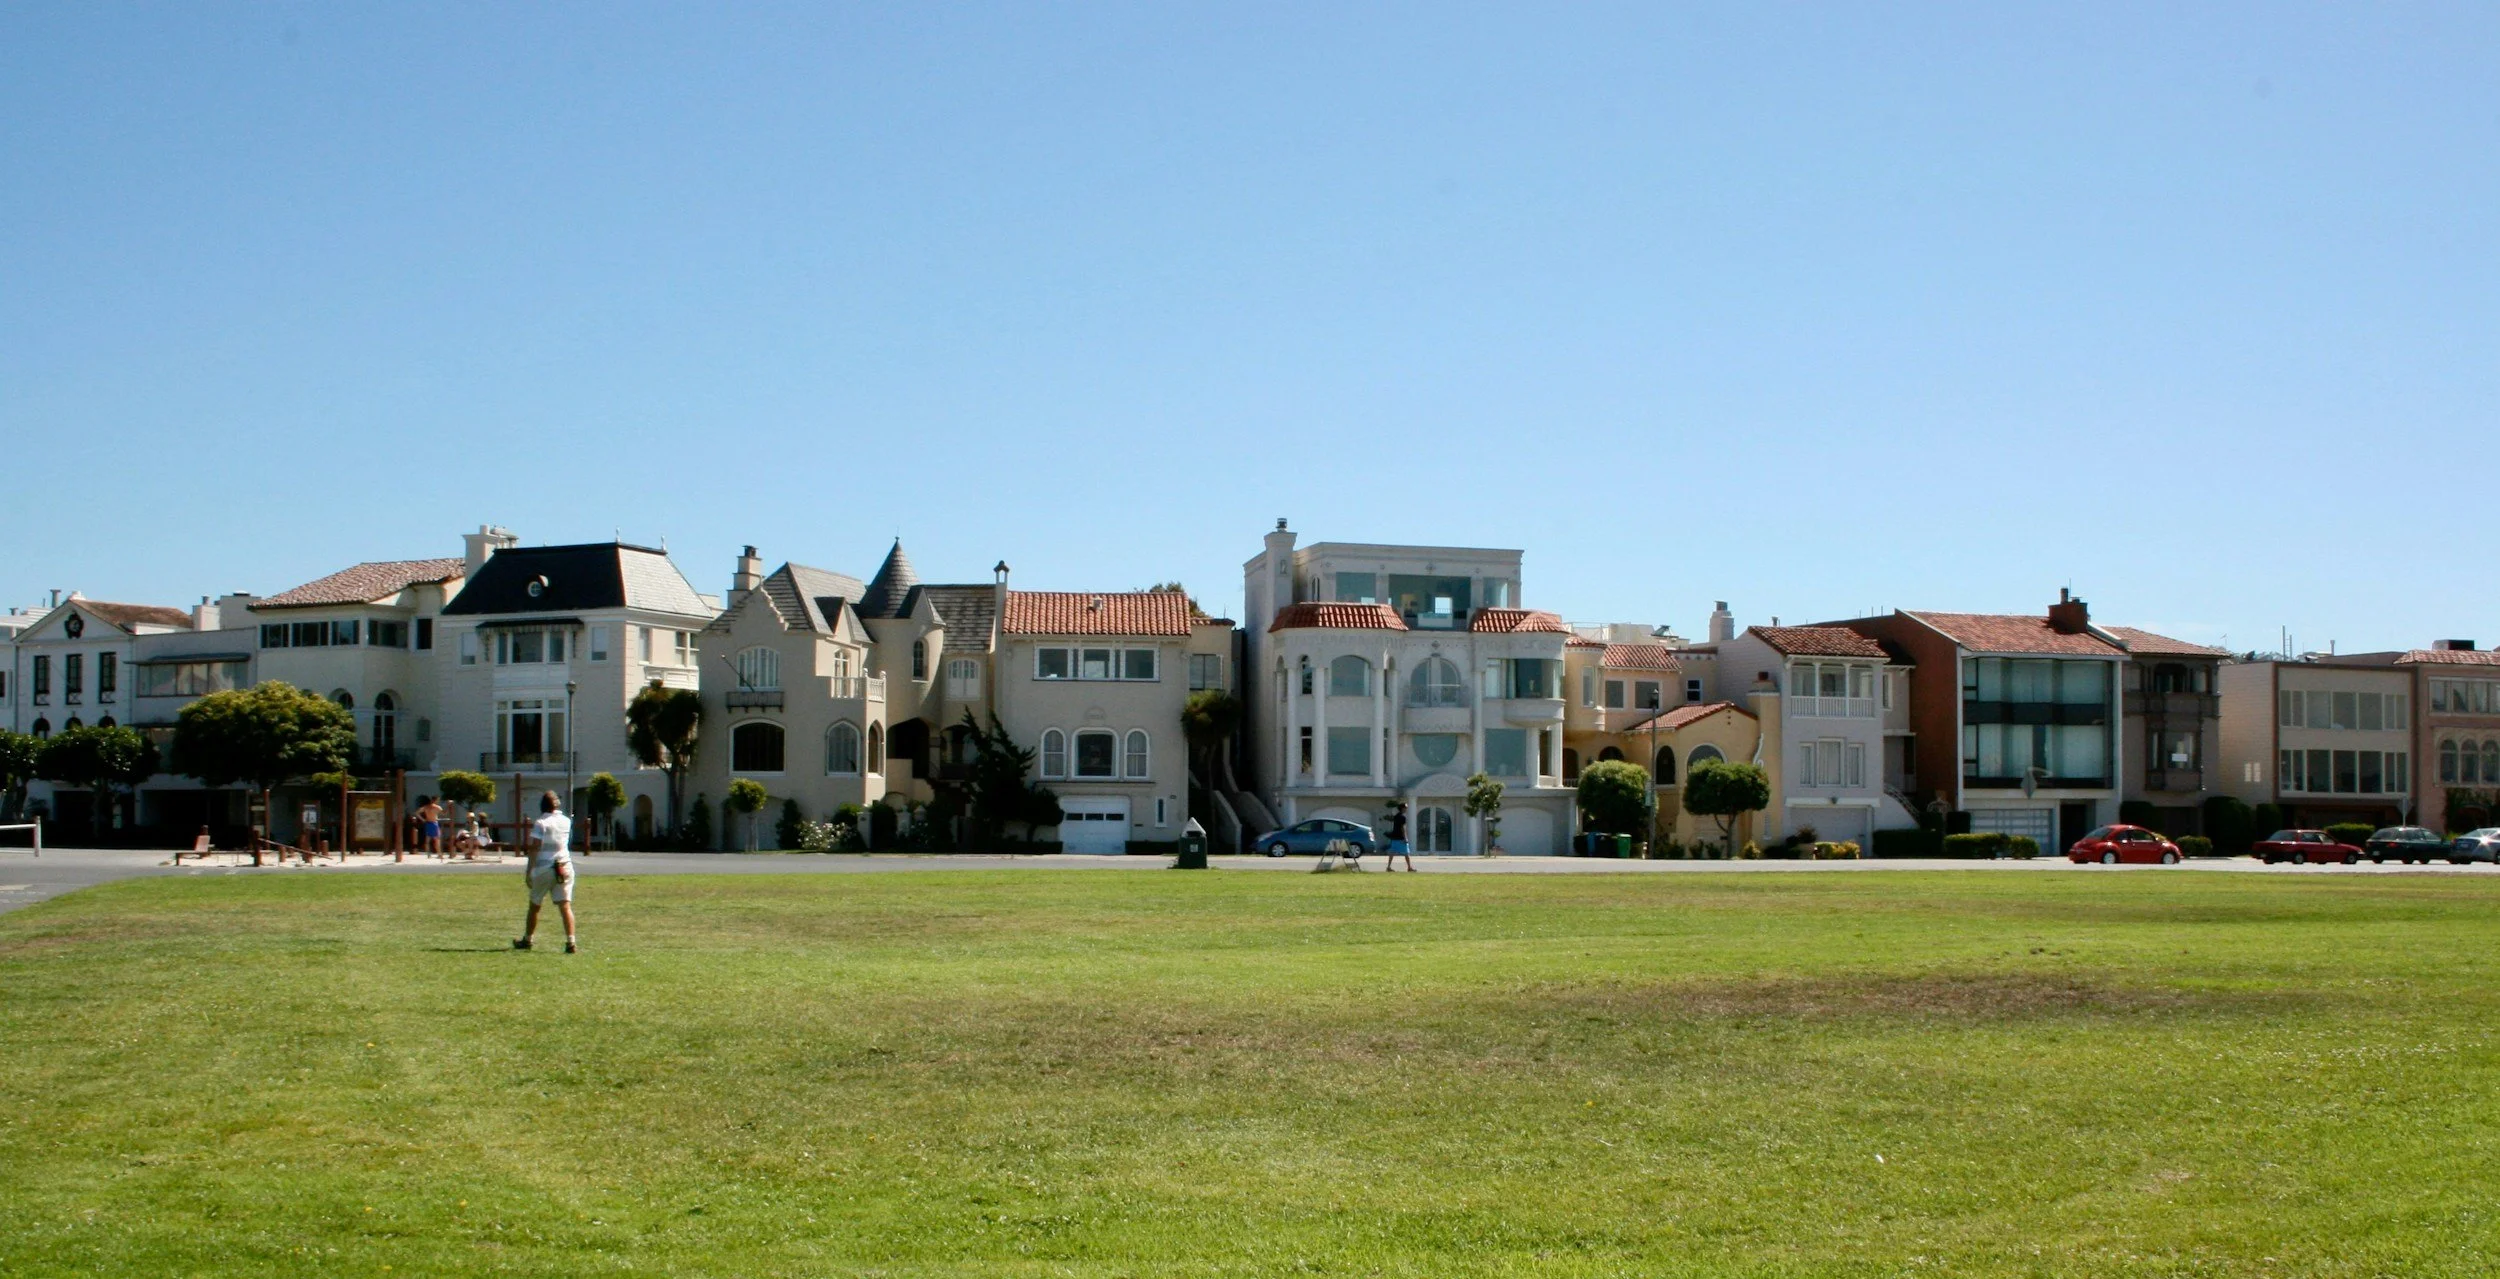
Summer Hasn’t Slowed San Francisco. Momentum Is Still Compounding.
San Franciso Real Estate Market Update - June 2026
"Hesitation has become more expensive.”
– Vanguard Properties
San Francisco’s spring market did not fade as it moved toward summer. If April showed that momentum had returned, May confirmed something more durable: buyer demand remains elevated, inventory is still tight, and well-prepared listings are continuing to command aggressive offers.
Single-family homes remain the most competitive part of the market, with the median sales price reaching $2,200,000, up 22.2% year-over-year. Sellers received an average of 124.9% of list price, and 83.8% of single-family homes sold over asking. Closed sales also rose 18.7% year-over-year, even as month-end inventory fell 20.5%.
The condo market also continues to rebuild. Median condo/TIC/co-op pricing rose more modestly, up 2.6% year-over-year to $1,325,000, but the underlying activity was stronger than that price figure suggests. Closed sales increased 21.7%, pending sales rose 10.3%, and month-end inventory fell 24.1%. The clearest signal: 59.3% of condos sold over list price, a 35.4% jump from last year.
This is not just a hot month. It is the continuation of the structural shift we covered in May. AI-sector wealth, limited supply, and renewed confidence in San Francisco are combining to create a market where hesitation is costing buyers and preparation is rewarding sellers.
San Francisco’s Spring Momentum Has Carried Into Summer
San Francisco’s May 2026 real estate market showed continued strength across both single-family homes and condos. Compared with April, the single-family median price climbed from $2,105,000 to $2,200,000, a 4.5% month-over-month increase. Median market time ticked up slightly from 11 to 12 days, but that is still a very fast pace for a citywide median.
Condos were more nuanced. The median condo/TIC/co-op sales price eased from April’s $1,377,500 to $1,325,000, but price per square foot rose 12.9% year-over-year,closed sales increased more than 21%, and inventory continued to compress. That points to a market that is not moving evenly across all properties, but is clearly healthier than it was a year ago.
| 🏠 Single Family Homes May 2026 |
🏢 Condominiums / TICs May 2026 |
|
|---|---|---|
| Median Sales Price | $2,200,000 ↑ 22.2% YoY | $1,325,000 ↑ 2.6% YoY |
| Days on Market | 12 ↓ 7.7% YoY | 15 ↓ 28.6% YoY |
| $/SQ. FT. | $1,193 ↑ 12.9% YoY | $1,153 ↑ 12.9% YoY |
| Avg. % of List Received | 124.9% ↑ 11.2% YoY | 107.8% ↑ 5.3% YoY |
| % Sold Over List | 83.8% ↑ 4.9% YoY | 59.3% ↑ 35.4% YoY |
| Went Into Contract | 237 ↓ 10.2% YoY | 278 ↑ 10.3% YoY |
| Properties Sold | 260 ↑ 18.7% YoY | 275 ↑ 21.7% YoY |
| # For Sale (Month-End) | 213 ↓ 20.5% YoY | 540 ↓ 24.1% YoY |
Source: Vanguard Properties – San Francisco Market Update (June 2026; May 2026 data). Data sourced from SFAR MLS & BrokerMetrics and deemed reliable but not guaranteed.
Source: Vanguard Properties, San Francisco Market Update, June 2026. May 2026 data sourced from SFAR MLS and BrokerMetrics. Data deemed reliable but not guaranteed.
Single-Family Homes: Still the Most Competitive Segment
Single-family homes remain the clearest seller-favorable category in San Francisco. The median sales price reached $2,200,000, up 22.2% from May 2025, while the average sale closed at 124.9% of list price. More than eight in ten homes sold over asking.
There is one metric worth watching: pending sales declined 10.2% year-over-year. On paper, that looks like a softening signal. In practice, Vanguard notes that it may understate demand because more homes are trading before full public exposure. That tracks with what buyers are feeling on the ground: the best homes are not waiting around.
For sellers, the lesson is not simply “list high and wait.” The homes getting the strongest results are prepared, positioned, and launched with precision. For buyers, the lesson is more uncomfortable: if the right home appears, the strategy needs to be ready before the tour.
Condos / TICs / Co-ops: The Recovery Is Broader Than Price Alone
The condo market is no longer the laggard it was in recent years. Median pricing increased only 2.6% year-over-year, but the competitive signals are stronger than the headline price suggests. Closed sales rose 21.7%, pending sales increased 10.3%, and days on market fell from 21 days last May to 15 days this May.
The biggest shift is buyer behavior. Nearly 60% of condos sold over asking in May, compared with 43.8% a year ago. Sellers received an average of 107.8% of list price, which is a meaningful improvement for a segment that had been uneven after the pandemic.
That said, this is still a selective market. Renovated condos, boutique buildings, strong floor plans, outdoor space, parking, and lower HOA profiles continue to outperform. Commodity units still need sharper pricing and stronger presentation.
Why San Francisco Is Still Bucking the National Trend

Nationally, elevated mortgage rates continue to weigh on affordability and keep many buyers cautious. Freddie Mac reported the 30-year fixed-rate mortgage averaged 6.48% as of June 4, 2026, down from 6.85% one year earlier, but still well above the ultra-low-rate environment many buyers remember.
San Francisco is behaving differently because the demand side is different. AI-sector compensation, equity wealth, and return-to-office patterns are bringing high-income buyers back into the city, particularly in scarce single-family and luxury segments. Recent market coverage has pointed to the same basic pattern: AI wealth is intensifying competition at the top of the market, while limited inventory keeps pressure on the broader field.
That does not mean every property will sell instantly or every buyer can ignore rates. It means San Francisco’s best-located, best-prepared homes are operating in a market with more demand than visible inventory.
Strategic Advice for Buyers and Sellers
For Buyers:
Speed matters, but speed without discipline is how buyers overpay for the wrong home. Get fully underwritten, know your ceiling, understand the neighborhood comps, and separate true dealbreakers from preferences. In this market, the decision window is short. The preparation window should happen before you start writing offers.
For Sellers:
You have leverage, but leverage still needs execution. The market is rewarding homes that are clean, well-presented, correctly priced, and launched with a clear strategy. The biggest mistake is assuming strong demand will fix weak preparation. It usually will not.
The Bottom Line
San Francisco has moved from recovery to confirmation. April proved the spring market had momentum. May showed that momentum is still compounding.
For buyers, the cost of waiting is becoming more visible. For sellers, the opportunity is real, but the best results are still going to those who prepare, price, and market with discipline.
Looking for a hyper-local strategy for your home? Schedule a consultation to review the data for your specific block.
Market Data & Sources
Vanguard Properties — San Francisco Market Reports / June 10, 2026 San Francisco Market Update.
All market statistics sourced from the Vanguard Properties San Francisco Market Update, June 2026. Data compiled from SFAR MLS and BrokerMetrics. Property types covered: single-family homes, condominiums, loft condominiums, TIC, and Stock COOP. Only property data posted on the MLS is covered. All information is deemed reliable but not guaranteed for accuracy. All data is subject to errors, omissions, and revisions. ©2026 Vanguard Properties. All rights reserved. Equal Housing Opportunity. DRE No. 01486075.