
Spring Has a Momentum Problem. The Market Is Moving Too Fast to Wait.
San Franciso Real Estate Market Update - May 2026

"The pressure point is supply. Buyers had fewer choices, and the best listings moved quickly."
– Vanguard Properties
San Francisco's spring market delivered. April data confirms what buyers have felt all season long: inventory is scarce, the best listings are moving in under two weeks, and sellers across both houses and condos are seeing results well above asking price. This isn't a seasonal blip — it's the continuation of a structural shift that's been building since 2025.
The driver is familiar but intensifying. AI-sector wealth is translating directly into housing demand, with high-earning talent flooding into the city, cash-reserve buyers sidestepping rate sensitivity entirely, and a lack of new supply compressing the field further. Active listings fell roughly 32% year-over-year in April — even tighter than the citywide numbers below suggest, because many of the best properties traded in Coming Soon status before hitting the open market.
For buyers, the window to hesitate has effectively closed. For sellers who prepare well and price strategically, this is one of the most favorable spring markets in recent memory. Here's the full picture.
San Francisco’s Spring Market Is Back in Motion
San Francisco’s April 2026 real estate market showed meaningful strength across both houses and condos. The defining feature was limited supply. Single-family inventory finished the month down nearly 28% year-over-year, while condo inventory fell 29%. That tightening created a more competitive environment, especially for well-prepared listings in desirable locations.
| 🏠 Single Family Homes April 2026 |
🏢 Condominiums / TICs April 2026 |
|
|---|---|---|
| Median Sales Price | $2,105,000 ↑ 18.3% YoY | $1,377,500 ↑ 17.5% YoY |
| Days on Market | 11 ↓ 8.3% YoY | 13 ↓ 53.6% YoY |
| $/SQ. FT. | $1,188 ↑ 11.3% YoY | $1,124 ↑ 8.8% YoY |
| Avg. % of List Received | 125.1% ↑ 9.4% YoY | 108.5% ↑ 6.5% YoY |
| % Sold Over List | 85.4% ↑ 9.8% YoY | 57.7% ↑ 65.3% YoY |
| Went Into Contract | 234 ↑ 6.4% YoY | 277 ↑ 17.9% YoY |
| Properties Sold | 247 ↑ 9.8% YoY | 272 ↑ 24.8% YoY |
| # For Sale (Month-End) | 213 ↓ 27.6% YoY | 529 ↓ 29.0% YoY |
Source: Vanguard Properties – San Francisco Market Update (May 7, 2026; April 2026 data). Data sourced from SFAR MLS & BrokerMetrics and deemed reliable but not guaranteed.
Single-Family Homes: Fast, Competitive, and Over Asking
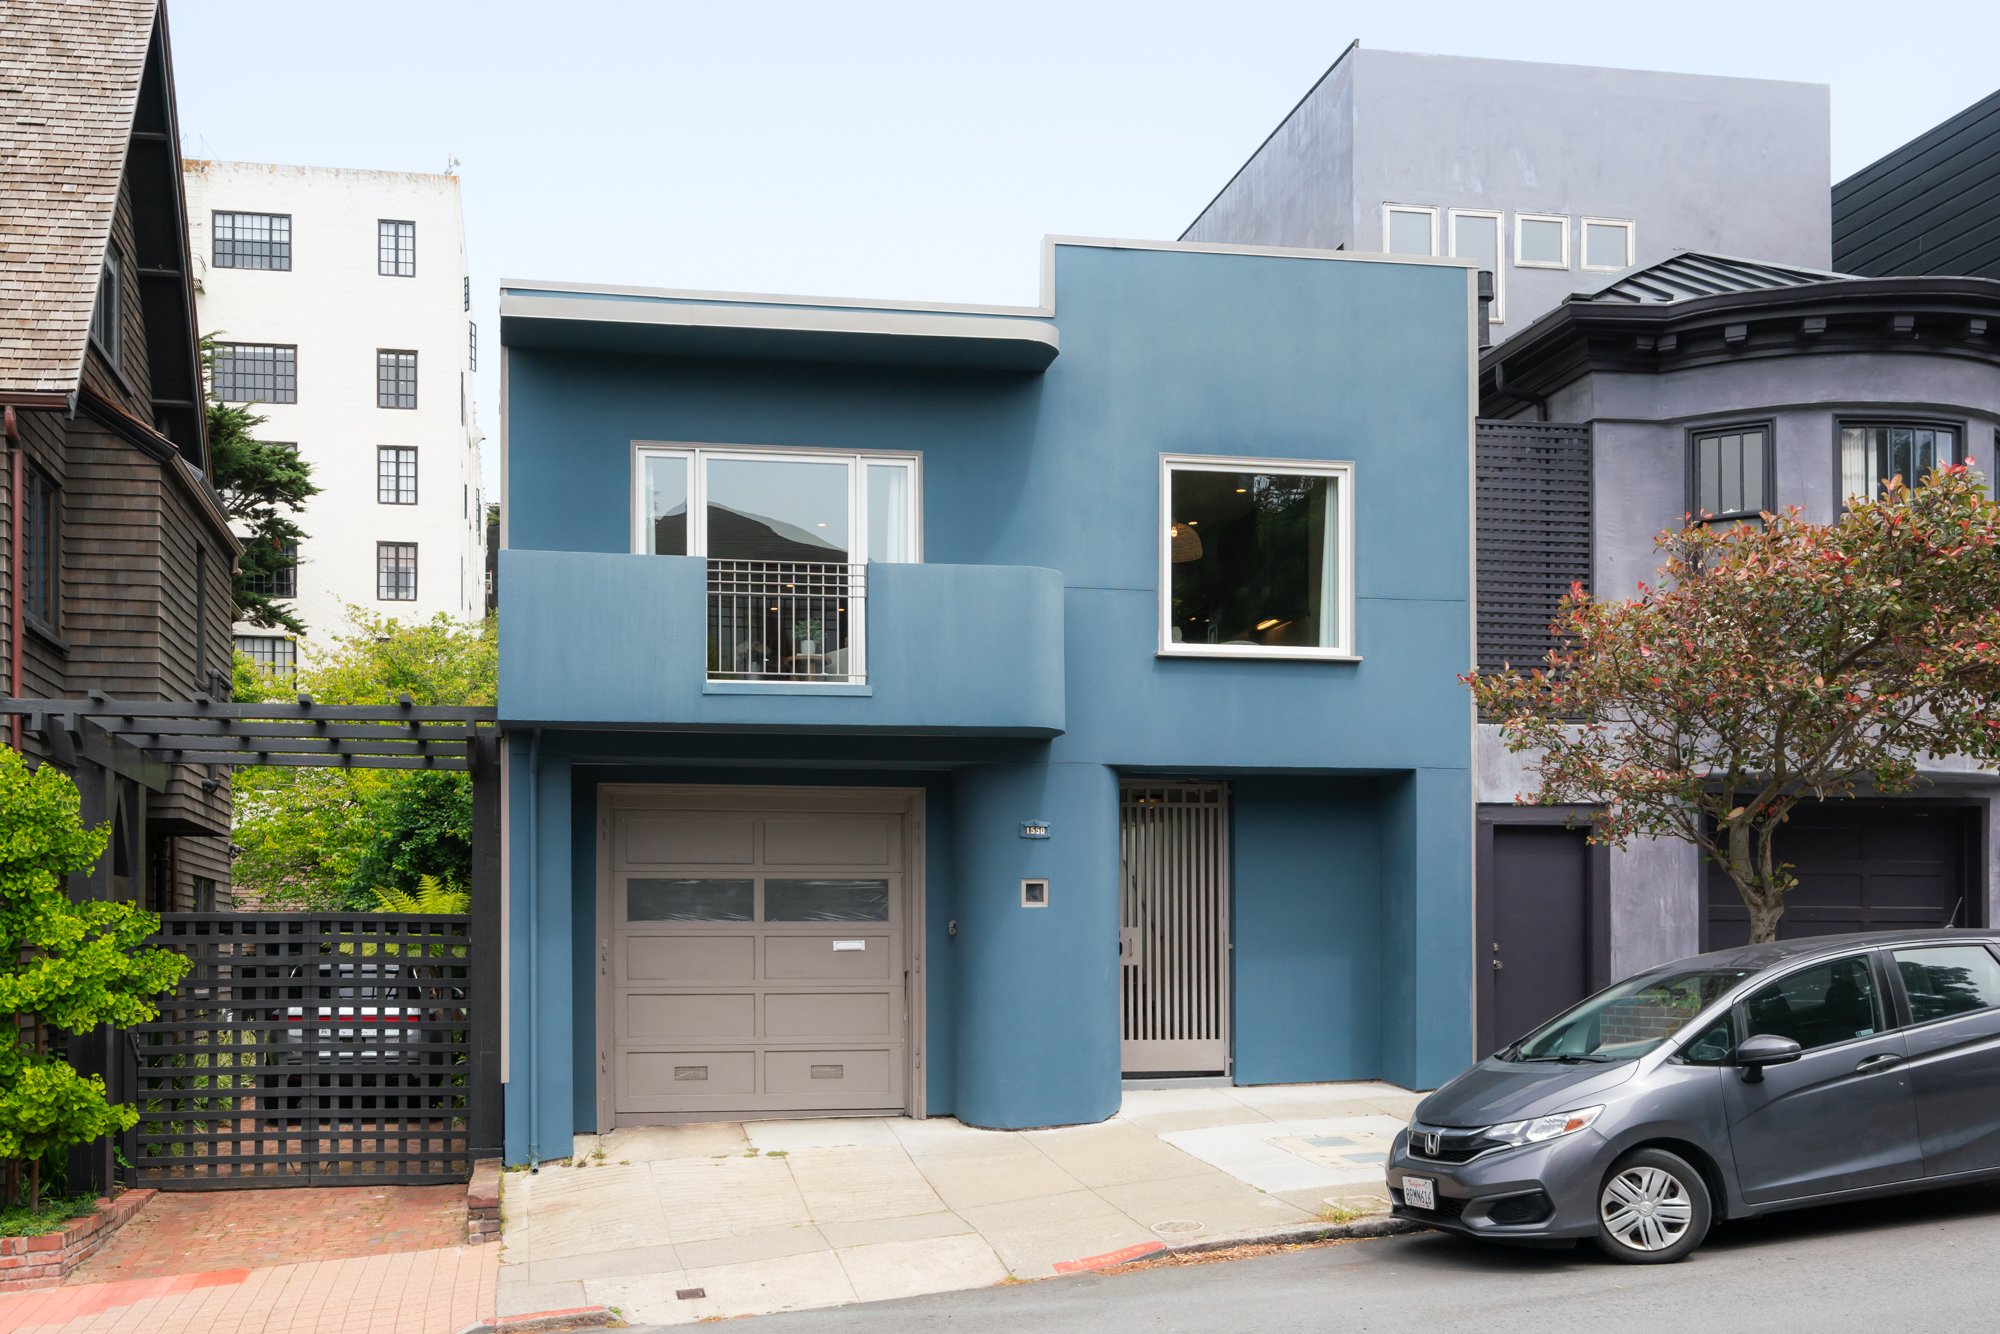
For Sale- 1550 Masonic Ave
$1,995,000
3 Bed | 2 Baths | 1-Car garage | 1,175 sq. ft.
The single-family market remains firmly in seller-favorable territory. The median sales price reached $2,105,000, up 18.3% year-over-year, while the median home sold in just 11 days. Sellers received an average of 125.1% of list price, and more than 85% of single-family sales closed over asking.
For sellers, this points to a market where presentation, pricing strategy, and launch timing can produce meaningful leverage. For buyers, it means preparation matters: underwriting, offer strategy, and neighborhood-level comps need to be ready before the right property appears.
Condos / TICs / Co-ops: The Comeback Accelerates

Recently Sold - 728 Castro
Sold 17% over list at $1,600,500
16 Days on Market
21 Day Closing
Condos delivered one of the strongest signals in the May report. The median condo/TIC/co-op sales price rose 17.5% year-over-year to $1,377,500, while closed sales jumped 24.8%. Market time improved dramatically, with median days on market falling from 28 days last April to just 13 days.
That does not mean every condo is equally competitive. Boutique buildings, renovated homes, strong layouts, outdoor space, parking, and lower HOA profiles continue to outperform. But the broader condo market is clearly healthier than it was a year ago.
Why San Francisco Is Bucking the National Trend
San Francisco continues to diverge from national housing trends, and the explanation is structural. AI-sector hiring and wealth creation are acting as a permanent price floor, according to analysts tracking the Bay Area market. High-earning talent is drawn in by salaries, stock options, and equity packages that dwarf most industries — and that influx is translating directly into housing demand.
Investment analysts have begun describing the Bay Area's housing rebound as 'AI-fueled' — pointing to limited new supply, dwindling available inventory, and bidding wars as the defining characteristics of the current cycle. The Wall Street Journal and national financial press have noted that San Francisco is bucking the cooling trend seen in most major metros, driven by the same network-effect dynamics that have historically defined the city's tech booms.
Mortgage rates, while still elevated versus historic norms, are running below last year's levels — giving rate-sensitive buyers additional purchasing power. And for cash-reserve buyers from the AI sector, rate sensitivity isn't a factor at all.
Strategic Advice for Buyers and Sellers
For Buyers:
The rise to 6.46% interest rates may feel daunting, but it has cooled the bidding frenzy in mid-tier neighborhoods, offering a small strategic window. With only 179 houses for sale citywide, the cost of waiting likely outweighs the cost of borrowing for long-term holds.
For Sellers:
You have significant leverage right now. Inventory is low, demand is high, and well-prepared homes are selling fast and above asking. The strategic move is to prepare your home properly, price it with precision, and launch in the spring window when buyer activity peaks. If you've been thinking about selling — the data says now is the time.
The Bottom Line
San Francisco real estate rewards the patient and the prepared. While the conflict in Iran creates short-term volatility in the bond market, the core fundamentals of our city—innovation, beauty, and a structural housing shortage—remain as strong as ever.
Looking for a hyper-local strategy for your home? Schedule a consultation to review the data for your specific block.
Market Data & Sources
Vanguard Properties — San Francisco Market Reports / May 7, 2026 San Francisco Market Update.
Freddie Mac — Primary Mortgage Market Survey, May 7, 2026.
All market statistics sourced from the Vanguard Properties San Francisco Market Update, May 2026. Data compiled from SFAR MLS and BrokerMetrics. Property types covered: single-family homes, condominiums, loft condominiums, TIC, and Stock COOP. Only property data posted on the MLS is covered. All information is deemed reliable but not guaranteed for accuracy. All data is subject to errors, omissions, and revisions. ©2026 Vanguard Properties. All rights reserved. Equal Housing Opportunity. DRE No. 01486075.