The short answer
In San Francisco, a list price is usually the point where bidding starts. It is rarely the price the seller expects to receive. In October 2026, single-family homes in the city sold for an average of 127.6% of list price, and 86.2% of them sold above asking. Condominiums, TICs and co-ops sold for an average of 112.1% of list price, and 69.4% sold above asking.
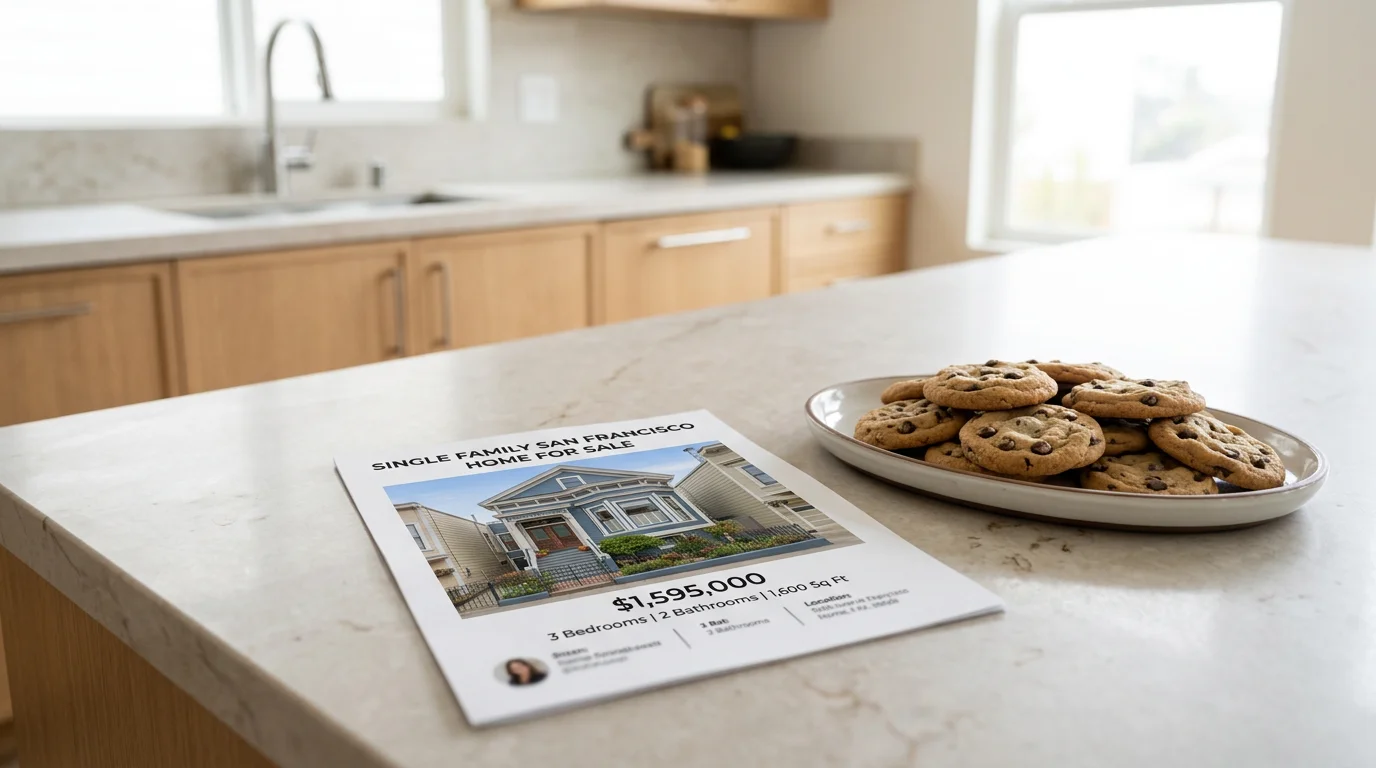
At the citywide average, a house listed at $1,595,000 would sell for about $2,035,000. That is arithmetic from an average, not a forecast for any particular home, and the gap varies widely by neighborhood and property type.
Why San Francisco homes are listed below what they sell for
Most San Francisco listings follow a familiar sequence. The home goes on the market at a price set to attract the widest group of qualified buyers. It is shown for one to two weeks. Offers are collected on a set date, and the seller chooses among them.
A lower list price does three things in that sequence. It places the home in more buyers' online searches, because buyers filter by price. It brings more people through the door in the first week. And it lets competing buyers, instead of the seller's opening number, establish the final price.
The list price in this system is a decision about marketing. The seller's expected price comes from recent comparable sales, and a well-advised seller knows that range before the home is listed.
The gap depends on where and what you are buying
The citywide average hides large differences. In Vanguard's most recent neighborhood table, average sale-to-list ratios ranged from 96.0% to 142.9% depending on neighborhood and property type. Most neighborhood figures rest on fewer than 50 sales, so read them as direction, not precision.
A list price on a Sunset house and a list price on a South Beach condo are two different kinds of number. In the first case the typical sale closed more than a third above asking. In the second, the list price was close to the sale price. The full table is in our Q3 market report.
| Neighborhood | Property Type | Avg. % of List Received | Homes Sold |
|---|---|---|---|
| Sunset | Single-family | 137.9% | 33* |
| Noe Valley | Single-family | 135.2% | 23* |
| Castro/Duboce Triangle (highlighted) | Single-family | 126.5% | 12* |
| Pacific/Presidio Heights | Single-family | 117.7% | 10* |
| Castro/Duboce Triangle (highlighted) | Condo / TIC | 110.3% | 27* |
| South Beach/Yerba Buena | Condo / TIC | 100.9% | 116 |
| SOMA | Condo / TIC | 100.3% | 40* |
| * Small sample size (n<50); use caution when interpreting statistics. Single-family values are September 2026; condo values are Q3 2026. Castro/Duboce Triangle highlighted. Source: Vanguard Properties San Francisco Market Update (October 2026). SFAR MLS & BrokerMetrics. Data deemed reliable but not guaranteed. | |||
Even experienced agents are being surprised
This fall the gap has been hard to predict. The Real Deal reported in October that several San Francisco brokers said they had underpriced listings without intending to, including a Noe Valley home that asked just under $7 million and sold for $9.1 million. The same article described a Pacific Heights home that listed and sold at $9.9 million.
A Compass analysis counted more than 140 San Francisco homes that sold for at least $1 million over asking in the first half of 2026.
The lesson for buyers and sellers is the same. The list price tells you less than it used to, and recent comparable sales tell you more.
If you are buying: how to read a list price
Start from comparable sales. Ask your agent for what similar homes nearby have sold for in the past 60 to 90 days. That range, adjusted for condition and size, is your estimate of value. The list price is not.
Check the local ratio for that property type. A condo in a large downtown building and a house in the western neighborhoods behave differently, as the table above shows.
Search below your ceiling. At the citywide average of 127.6%, a buyer with a $2,000,000 limit is competing for houses listed around $1,567,000. Your own number depends on the neighborhood.
Note whether there is an offer date. A set offer date signals that the seller expects competition. A listing with no offer date, or one that has been on the market for several weeks, may be priced closer to what the seller will accept.
Decide your ceiling before offer day. Set it from the comparable sales and your monthly payment at today's rate, and hold to it.
If you are selling: three ways to set a list price
Below expected value, with an offer date. This is the most common approach for single-family homes in San Francisco. It maximizes exposure and competition. It works when the home is well prepared and demand in that segment is strong. The risk is that fewer offers arrive than expected, and the seller has to decide whether to accept less than hoped or adjust course.
At expected value. The home is listed near what comparable sales support. Buyers who dislike bidding contests often prefer this, and it suits segments where sale prices track list prices closely, such as many larger condo buildings.
Above expected value. Listing high to see what happens tends to fail. Buyers compare the home against better-priced alternatives, it sits, and a price reduction follows. A home that has been reduced usually sells for less than it would have with a sound price on day one.
Which approach fits depends on the property type, the neighborhood, the season and how many comparable homes are for sale that week. We set list prices property by property, from current comparable sales, after the preparation and staging plan is settled.
Frequently asked questions
-
Not necessarily. Many San Francisco homes are listed below the price the seller expects, with offers reviewed on a set date. Sellers are generally not obligated to accept an offer at list price. Ask your agent how a specific listing is being handled.
-
In October 2026, single-family homes sold for an average of 127.6% of list price and condominiums, TICs and co-ops for an average of 112.1%, according to Vanguard Properties data from SFAR MLS and BrokerMetrics. The ratio varies by neighborhood and property type.
-
Base the offer on recent comparable sales for that home, not on a percentage over list price. The right number for one home can be 5% over asking and for another 40% over.
-
More often than a year ago. 69.4% of San Francisco condos sold above list price in October 2026, up from 44.2% in October 2025. In some downtown neighborhoods the average sale still closes near list price.
Want to know what your home would list for, and what it would likely sell for?
Those are two different numbers, and we will give you both.
Market Data & Sources
Citywide figures: Vanguard Properties – San Francisco Market Update, November 2026. October 2026 data sourced from SFAR MLS and BrokerMetrics. Neighborhood figures: Vanguard Properties – San Francisco Market Update, October 2026. Only property data posted on the MLS is covered. All information is deemed reliable but not guaranteed.
The Real Deal, "Bidding wars & AI wealth: Can anyone price right in San Francisco's unpredictable market?", October 18, 2026. Compass analysis of sales at least $1 million over asking, first half of 2026.
Dollar examples are illustrations calculated from citywide averages and are not predictions for any property. Mark D McHale is affiliated with Vanguard Properties, Inc., a licensed California real estate broker. DRE# 01243912. This content is for informational purposes only and is not legal or financial advice.