San Francisco’s Median Slipped in August. The Competition Didn’t.
San Franciso Real Estate Market Update - September 2026

Sustained buyer engagement heading into the autumn selling season
August delivered the kind of month that gets misread at a glance. The single-family median sales price came in at $1,855,000, down 8.5% from July. Read that line alone and you would conclude San Francisco finally cooled.
Every other measure says the opposite. Sellers received an average of 124.1% of list price. 86.4% of single-family homes sold over asking, up from 69.9% a year ago. Month-end single-family inventory fell 28.4% year-over-year to just 131 homes. Year-over-year, the median is still up 23.7%.
The condo market was the bigger story. Median market time fell from 48 days last August to 14, a 70.8% drop and the fastest August pace in Vanguard’s series dating to 2010. The share of condos selling above asking nearly doubled, from 28.6% to 53.5%. Closed condo sales rose 16.2%.
The headline is simple. The median moved down. Competition moved up. Those two things are not in conflict, and understanding why is the difference between reading this market correctly and reacting to it.
Why the Median Fell While Competition Rose
The national backdrop sharpened last week. On September 16, the Federal Reserve raised its benchmark rate a quarter point to 3.75%–4%, the first increase in more than three years, citing inflation still running above target. Freddie Mac put the 30-year fixed-rate mortgage at 6.95% the following day, up from 6.26% a year earlier.
Two things are worth separating. First, the data in this report is August data — it predates the decision, and nothing here reflects how buyers respond to it. Second, the pattern this report describes was already running against the rate environment. Mortgage rates rose through the summer and San Francisco's over-asking share rose with them, from 69.9% to 86.4% for single-family homes. In most of the country those two lines move in opposite directions. Here, scarce supply and a demand base less sensitive to financing costs have been overriding the rate picture for months. Whether that holds through the autumn is the open question, and the October report is where we'll see the first evidence.The Bottom Line
What You Missed Between July and September
Our last market report covered Q2. Here is the bridge, because July mattered.
July was the peak. The single-family median hit $2,027,500, up 24.2% year-over-year, with sellers receiving 126.7% of list price and 86.0% of homes selling over asking at a 12-day median market time. Condos closed 275 sales, up 26.1% year-over-year, at a $1,250,000 median and 105.3% of list.
Then August arrived and did what August does in San Francisco. Fewer homes traded: single-family closings fell from 178 to 154, condo closings from 275 to 215. The mix shifted toward smaller, less expensive properties, and the median followed it down.
What did not soften: the percentage of list price sellers received, the share of homes selling over asking, or the speed of the condo market. Those three measures all held or improved. A median that falls while competition metrics rise is a mix story, not a demand story.
| Metric | Single Family Homes | Condominiums / TICs / Co-ops | ||
|---|---|---|---|---|
| Median Sales Price | $1,855,000 | ↑ 23.7% YoY | $1,225,000 | ↑ 20.1% YoY |
| Days on Market | 13 | ↓ 1 day YoY | 14 | ↓ 34 days YoY |
| $/SQ. FT. | $1,108 | ↑ 18.6% YoY | $1,129 | ↑ 18.1% YoY |
| Avg. % of List Received | 124.1% | ↑ 9.4 pts YoY | 106.3% | ↑ 6.2 pts YoY |
| % Sold Over List | 86.4% | ↑ from 69.9% YoY | 53.5% | ↑ from 28.6% YoY |
| Went Into Contract | 143 | ↓ 4.0% YoY | 213 | ↑ 2.9% YoY |
| Properties Sold | 154 | ↑ 0.7% YoY | 215 | ↑ 16.2% YoY |
| # For Sale, Month-End | 131 | ↓ 28.4% YoY | 415 | ↓ 22.4% YoY |
| Source: Vanguard Properties San Francisco Market Update, September 2026. August 2026 data sourced from SFAR MLS and BrokerMetrics. Data deemed reliable but not guaranteed. | ||||
Single-Family Homes: Fewer Trades, Tighter Market
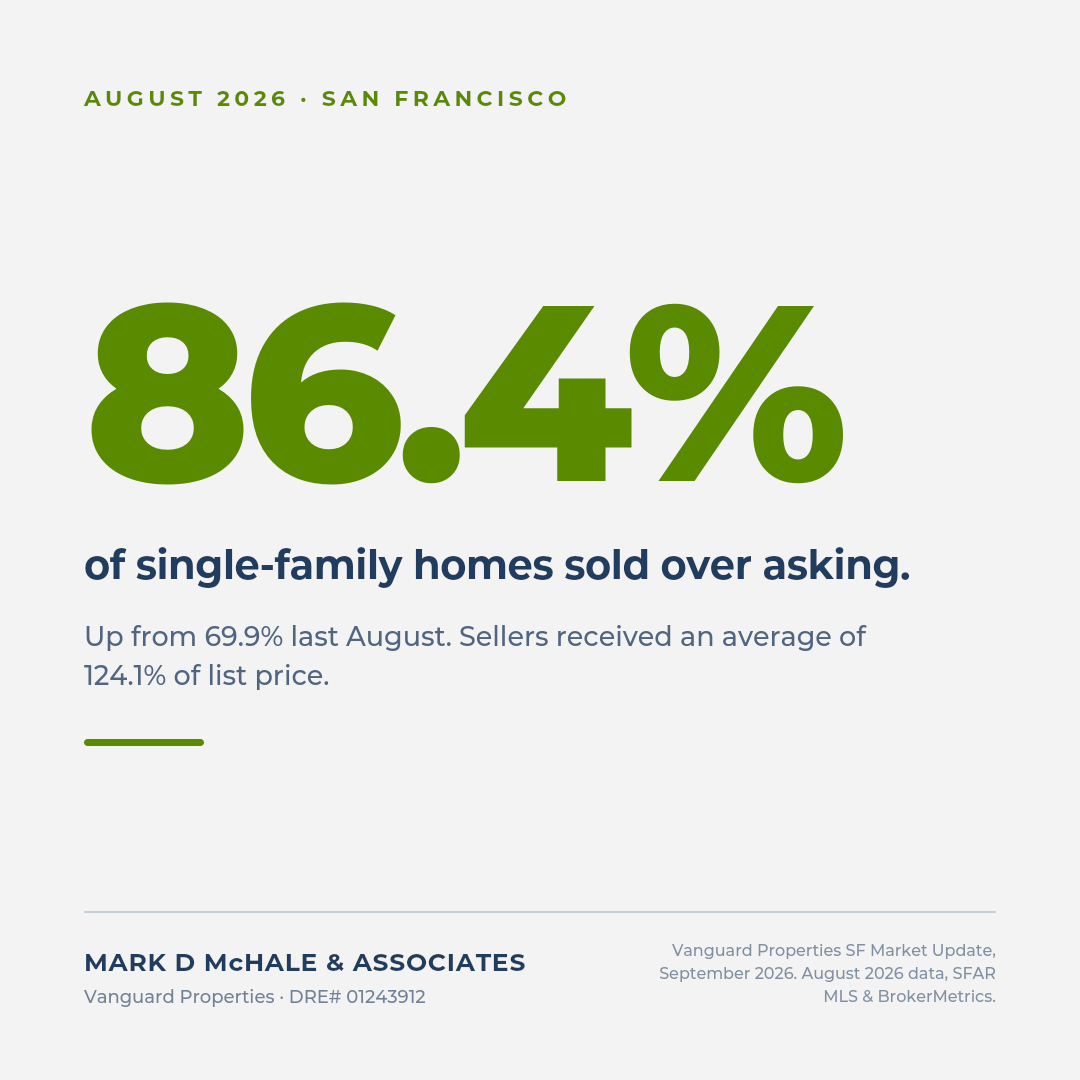
The single-family segment is now operating on genuinely scarce supply. 131 homes were listed for sale at month-end, down 28.4% from a year ago. That is the tightest inventory reading in this cycle, and it is the number that explains the rest of the table.
Against that backdrop, 154 homes closed, up 0.7% year-over-year, and 86.4% of them sold over asking. Price per square foot rose 18.6% to $1,108. Median market time was 13 days.
Pending sales fell 4.0% year-over-year to 143. That is the one metric pointing the other direction, and it deserves an honest read: with 131 homes available citywide, there is a ceiling on how many contracts can be written. Softer pending counts on this inventory base reflect what is available to buy, not what buyers are willing to do.
Condos / TICs / Co-ops: The Fastest August Since 2010
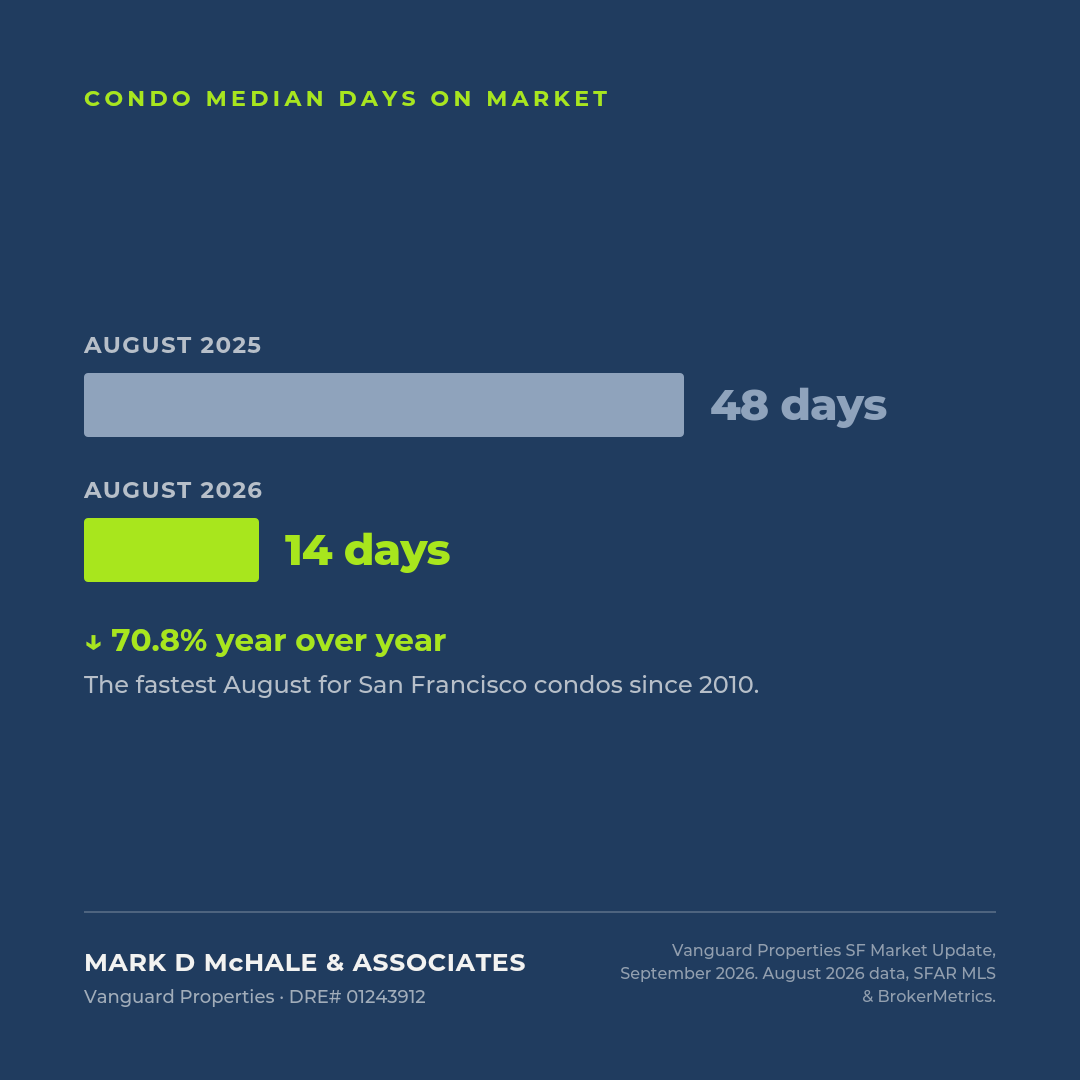
The condo recovery stopped being a price story and became a velocity story.
Median market time collapsed from 48 days to 14. In a segment that spent the post-pandemic years defined by slow absorption and negotiating room, that is the single most consequential number in this report. More than half of condos, 53.5%, now sell above asking, compared with 28.6% last August. Sellers received an average of 106.3% of list price.
Pricing followed. The median reached $1,225,000, up 20.1% year-over-year, with price per square foot at $1,129, up 18.1%. Month-end inventory fell 22.4% to 415 units.
The selectivity that defined this segment has not disappeared entirely. At the neighborhood level, the spread remains wide: Pacific/Presidio Heights condos carry a $1,885,000 median at 109.6% of list, while South Beach/Yerba Buena sits at $1,200,000 and 98.7% of list. Renovated units, boutique buildings, outdoor space, parking, and lower HOA profiles still outperform. The difference is that the gap is narrowing faster than it has in a decade.
Strategic Advice for Buyers and Sellers
For buyers
Do not let a month-over-month median headline tell you the market gave you room. It did not. With 131 single-family homes available citywide and 86.4% selling over asking, the practical reality is unchanged: be underwritten before you tour, know your ceiling, and understand that the properties worth competing for will not wait through a deliberation cycle. Condo buyers in particular have lost the negotiating window they had a year ago, and that shift happened in roughly twelve months.
For sellers
August was a strong month to sell, and September and October are historically stronger. Autumn is San Francisco’s second selling season, and it is arriving with the tightest inventory in this cycle. Condo sellers who have been waiting for the market to come back should look closely at the 14-day median and the 53.5% over-asking share before deciding to wait another season. Preparation, pricing, and launch strategy still determine results. Demand this strong rewards execution; it does not substitute for it.
What does this market mean for your next move?
Citywide statistics establish the backdrop. The right decision depends on your property, neighborhood, timing and financial goals.
Market Data & Sources
Vanguard Properties – San Francisco Market Update, September 2026. August 2026 data sourced from SFAR MLS and BrokerMetrics. Property types covered: single-family homes, condominiums, loft condominiums, TICs, and stock co-ops. Only property data posted on the MLS is covered. Data deemed reliable but not guaranteed.
Vanguard Properties – San Francisco Market Update, August 2026. July 2026 data sourced from SFAR MLS and BrokerMetrics.
Freddie Mac Primary Mortgage Market Survey, September 17, 2026.
Federal Open Market Committee statement, September 16, 2026.